
Central Roof Repair · Seasonal
A Central Kentucky roof has a freeze season, and it is shorter and more specific than most homeowners assume. In NOAA’s 1991–2020 climate normals for Lexington Bluegrass Airport, exactly three months carry an average daily low below freezing: December at 29.6°F, January at 25.4°F and February at 28.3°F. Those same three months account for 11.1 of Lexington’s 14.5 average annual inches of snow. Everything a roof does badly in winter, it does in that window — and November, the driest month on the entire record at 3.37 inches, is when you cannot see it coming.
Last updated: November 5, 2026
How many months does a Lexington roof spend below freezing?
Three, on average: December, January and February. Average daily lows at Lexington Bluegrass Airport are 29.6°F, 25.4°F and 28.3°F in NOAA’s 1991–2020 normals.
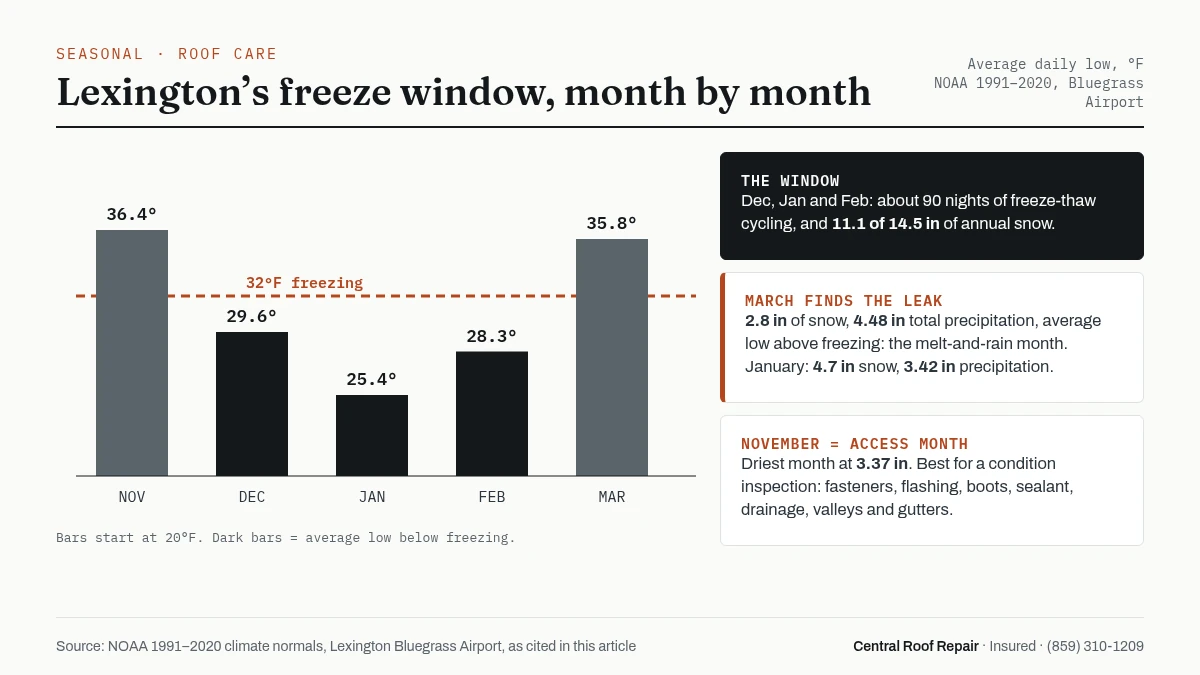
March’s average low climbs to 35.8°F and November’s sits at 36.4°F. That does not mean a hard freeze never lands in March or November — a normal is a thirty-year average, not a floor. What it means is that the stretch where a roof is reliably cycling through freezing every night, night after night, is about ninety days long. Freeze-thaw damage is cumulative and it is driven by the number of cycles, not the lowest temperature reached, so a ninety-day window is the right planning number.
| Month | Avg. low (°F) | Snow (in) | Precipitation (in) |
|---|---|---|---|
| November | 36.4 | 0.4 | 3.37 |
| December | 29.6 | 1.9 | 4.20 |
| January | 25.4 | 4.7 | 3.42 |
| February | 28.3 | 4.5 | 3.64 |
| March | 35.8 | 2.8 | 4.48 |
| Annual | — | 14.5 | 49.84 |
Why March is the quiet problem month
Because March pairs 2.8 inches of snow with 4.48 inches of total precipitation and an average low above freezing. That is the melt-and-rain combination, not the deep-freeze one.
Look at the table as a sequence rather than a list. January is the snowiest month at 4.7 inches but one of the driest overall at 3.42 inches of total precipitation — cold, dry, and mostly locked up. March is wetter than January by more than an inch, still carries 2.8 inches of snow, and runs above freezing overnight. A roof that accumulated ice through the three-month window meets its first sustained rain-on-melt event in March, and that is when a defect that has been quietly storing water announces itself inside the house.
January is the snowiest month and one of the driest. March is the one that finds the leak.
What the record says about scheduling an inspection
November is the driest month in Lexington at 3.37 inches and the last month with an average low above freezing before the window opens. That makes it the access month.
There is an honest tension here worth naming. November is the easiest month to get on a roof safely and see it dry — and it is the hardest month to find a water-driven defect, precisely because the water is not there. Those are two different jobs. A November look is a condition inspection: fasteners, flashing, boots, sealant, drainage paths, debris in valleys and gutters. Finding an active leak is a wet-weather job and the record says your chances are best in the wet quarter, when May, June and July average 5.44, 4.96 and 5.12 inches. If a homeowner tells us the ceiling stains only in a certain kind of weather, we plan around the weather rather than the calendar.
Two code points sit behind the freeze window and are worth reading before winter rather than during it. Kentucky’s design snow load and wind speed figures are county-specific — see Kentucky roof design: 115 mph wind and 15 psf snow load by county. And whether your roof is required to carry an ice barrier at the eave is a code question with a definite answer: is an ice barrier required on a Kentucky roof? If ice is already forming at your eaves each winter, ice dam prevention and repair covers the mechanism and the fixes.
For current conditions and forecasts across Central Kentucky, the National Weather Service office is NWS Louisville, which publishes the regional climate records.
Questions homeowners ask about the freeze season
Does an average low above freezing mean March is safe?
No. A climate normal is a thirty-year average, not a minimum. March’s average low of 35.8°F means most March nights do not freeze — individual nights absolutely do, and a March freeze following a melt is the worst version of the cycle.
Is 14.5 inches of snow a year a lot for a roof?
It is modest as a load and significant as a cycle count. Kentucky’s design snow load is set by code, not by the annual total; the damage pattern we see comes from repeated freeze-thaw and from melt water finding a path, not from the weight of a single storm.
When should gutters be clear by?
Before December, when the average low first drops below freezing. A blocked gutter in a month that cycles through freezing holds standing water and ice at the eave, which is the condition an ice barrier exists to defend against.
Disclosure: Central Roof Repair is owned by Marcos Gil, who also owns Central Property Services and publishes marcosgilrealty.com, forsalelexingtonky.com and investinthegorge.com.
By Central Roof Repair · Call or text (859) 310-1209.
Leave a Reply